May 2nd was an important time in Canada. It was either the repeat of the Conservatives, or a change in government. As I stepped up to the polling booth, I returned to the ballot box in five seconds (or so) and was greeted by “wow, you were fast.” You see, I knew who I wanted to vote for. Why? Because the Student Vote gave me a great experience on voting! That’s why I believe that educating the youth (especially about politics) is key. So the next time a federal election happens, get on board and sign your school up.
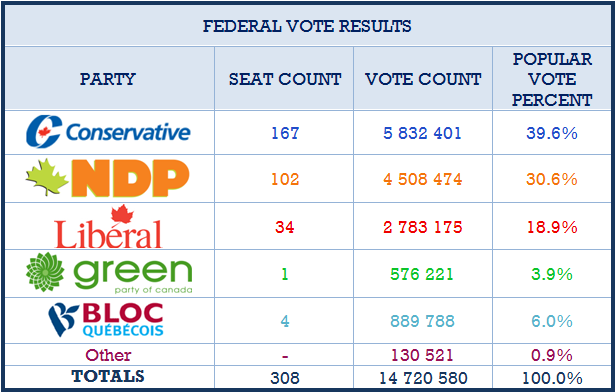
So without further ado, I give you a comparison chart of both the student vote results, and the actual election‘s results.
Also, here’s a general map of what each province voted for. It’s not 100% accurate, but it’s really interesting to see what each of the provinces and territories voted! Oh yeah, NDP won a riding in Edmonton (that’s the little speck of orange you see in Alberta).
Are you satisfied with the results? Comment below! I’ve decided to give you a little food for thought:
Out of 23.6 million electors in the last election, only 5.2 million voted for Harper’s Conservatives. That’s 22% of eligible voters, and 16.2% of the total population. There are 5.65 million Canadians aged 18-29. In the past, this age group has voted so little that politicians don’t bother with them. If all of Canada’s youth voted, they would rock the whole political system!


